
The United States is one of the largest producers of natural gas and among the countries included in the map has seen the biggest increase in shale gas production. The U.S. map shows a significant increase in general unconventional gas production since around 2007, however, tight gas and coal bed methane production have slowed during that time period. This graph shows how much shale production contributes to the gas production in the U.S., especially over the last seven years.
The interactive map also allows you to search by the type of gas. Of the countries included there are only five who recorded shale gas output as of 2012. Of those five, the U.S. has the longest history of shale production and the largest amount.
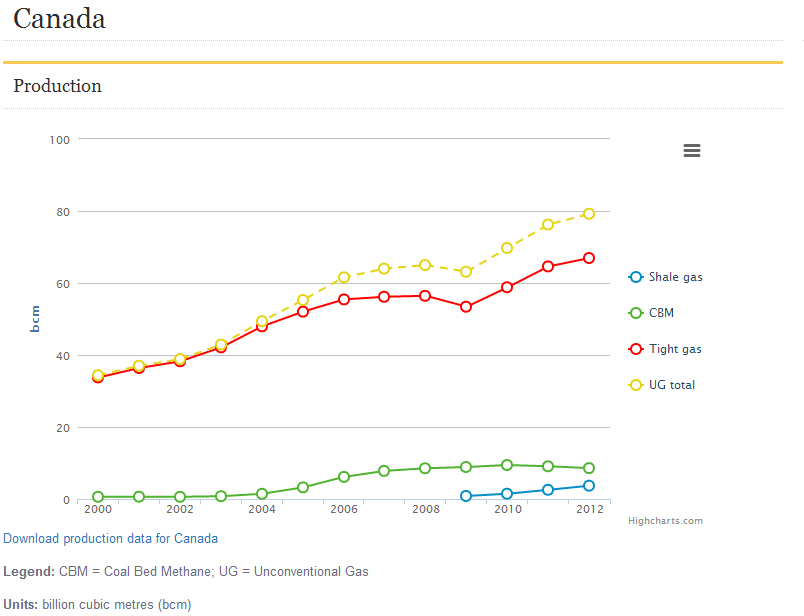
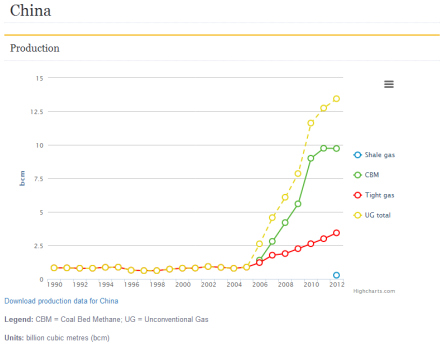
The U.S. has truly pioneered the shale gas industry, as seen in these charts below. Other countries have started to follow suit by adopting the technology and methods that were developed in the U.S. The other four countries with shale gas development are Canada, China, Argentina, and Poland. After the Unites States Canada is the next country who recorded shale output in 2009 and has also seen a slight increase since then. For a more visual comparison we included the graphs from each of the other four shale producing countries.
The map was built off of the work that IEA’s Unconventional Gas Forum does to promote the production of natural gas around the world. As stated on the IEA’s website,
The IEA created the Forum to inform decision makers around the globe on best operational and regulatory practices to capture the economic, security and other benefits of increased unconventional gas output.
This past March the forum hosted its second annual meeting in Canada where the focus was on safe and minimal use of water during unconventional gas production.